Posts

Showing posts from June, 2025

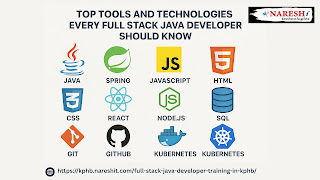
Must-Know Tools and Technologies for Every Full Stack Java Developer in 2025
Image
 If you're planning to become a Full Stack Java Developer, congratulations — you're aiming for one of the most in-demand and rewarding careers in the software world. But it’s not just about learning Java. Today’s full stack roles demand a broad skill set covering frontend, backend, database, DevOps, and more. Whether you’re a student, fresher, or working professional considering Full Stack Java Training in KPHB , this guide will walk you through the key tools and technologies you’ll need to master. 🔧 Backend: Core Java & Spring Ecosystem Your full stack journey starts with mastering Core Java — this includes object-oriented programming, exception handling, collections, and multithreading. But to build powerful web apps, you'll also need to dive into: Spring Boot – Quickly build RESTful APIs and microservices. Spring MVC – For creating structured web apps. Spring Security – Add login, roles, and protection. Spring Data JPA – For seamless database inte...

Designing Eye-Catching Dashboards in Power BI: Best Practices

Image
  In the world of business intelligence, dashboards are more than just charts and numbers—they’re tools for telling stories with data. Power BI, Microsoft’s leading data visualization platform, makes it easier than ever to build dynamic, interactive dashboards. But to make your dashboards not just informative, but eye-catching , you need to follow some proven design practices. Whether you're new to data visualization or currently undergoing Power BI training , this guide will walk you through essential tips to help you create dashboards that impress and inform. Why Good Dashboard Design Is Important A well-designed Power BI dashboard ensures that your audience can quickly grasp the insights they need. It improves decision-making, saves time, and presents data in a way that’s both accessible and impactful. Best Practices for Power BI Dashboard Design 1. Understand Your Audience Your dashboard should serve its viewers. Executives may prefer high-level KPIs, while analysts might nee...

Data Governance in Power BI: Securing Data, Sharing Smartly & Staying Compliant

Image
 In today’s digital business world, data is power. But with great data comes great responsibility. Tools like Power BI have made data visualization and business insights easy and impactful—but how do we keep that data secure, share it properly, and meet compliance regulations? That’s where data governance in Power BI comes into play. Whether you're a business analyst or a beginner looking to upskill with Power BI training , understanding these core principles is essential. 🔒 Securing Your Data in Power BI Security isn’t just an IT concern anymore—every report and dashboard must protect sensitive information. Here’s how Power BI helps you keep data secure: Role-Level Security (RLS): You can control who sees what by defining roles and setting up filters at the data level. Data Encryption: Power BI automatically encrypts your data both when it's stored and when it's being transferred. Sensitivity Labels: Integrated with Microsoft Purview, these labels help class...

Power BI and AI: Transforming Dashboards for Smarter Business Decisions

Image
 In today’s fast-paced digital world, businesses are flooded with data. But having data isn’t enough—it’s about what you do with it. This is where Power BI , powered by Artificial Intelligence (AI) , comes into play. Combining Power BI with AI unlocks a new level of data analytics, offering smarter dashboards that drive real business value. Whether you’re a startup or an enterprise, AI-powered dashboards in Power BI can give you the insights needed to stay ahead of the curve. What Makes Power BI and AI a Perfect Pair? Power BI by Microsoft is already a favorite among professionals for its powerful data visualization features. Now, with built-in AI tools, it’s evolving from a data reporting tool to an intelligent analytics platform. Here’s how Power BI + AI is making dashboards smarter: 🔍 Ask Questions, Get Answers : With the Q&A feature, you can type natural questions like “Which product had the highest sales in May?” and Power BI instantly provides the answer in visual...

How Power BI is Transforming Decision-Making Across Industries

Image
 In the age of big data, organizations are no longer making decisions based on assumptions—they rely on data-driven insights. One of the most powerful tools enabling this shift is Microsoft Power BI . From small businesses to global enterprises, Power BI is helping industries make smarter, faster, and more accurate decisions. Whether you're in finance, retail, healthcare, or manufacturing, understanding how to leverage data can give you a competitive edge. And that’s exactly what Power BI offers. What is Power BI and Why Does It Matter? Power BI is a business analytics tool developed by Microsoft. It allows users to connect to multiple data sources, visualize data through interactive dashboards, and share insights across the organization. It simplifies complex data and makes it understandable for decision-makers at every level. Here’s why it’s gaining popularity: Easy integration with Excel, Azure, and other Microsoft products Drag-and-drop interface for building reports ...